Apollo: An ML-Assisted Real-Time Storage Resource Observer
Apollo: An ML-assisted Real-Time Storage Resource Observer
CCS CONCEPTS
• Computer systems organization → Real-time system architecture; Client-server architectures; • Information systems → Multidimensional range search; Hybrid storage layouts.
KEYWORDS
Resource Monitoring, Storage Monitoring, Storage Utilization, HPC Cluster Monitoring, Low Latency Monitoring, Real-Time Monitoring
ACM Reference Format:
Neeraj Rajesh, Hariharan Devarajan, Jaime Cernuda Garcia, Keith Bateman, Luke Logan, Jie Ye,, Anthony Kougkas, and Xian-He Sun. 2021. Apollo: An ML-assisted Real-Time Storage Resource Observer. In Proceedings of the 30th International Symposium on High-Performance Parallel and Distributed Computing (HPDC '21), June 21-25, 2021, Virtual Event, Sweden. ACM, Stockholm, Sweden, 13 pages. https://doi.org/10.1145/3431379.3460640
Permission to make digital or hard copies of all or part of this work for personal or classroom use is granted without fee provided that copies are not made or distributed for profit or commercial advantage and that copies bear this notice and the full citation on the first page. Copyrights for components of this work owned by others than the author(s) must be honored. Abstracting with credit is permitted. To copy otherwise, or republish, to post on servers or to redistribute to lists, requires prior specific permission and/or a fee. Request permissions from [email protected].
HPDC'21, June 21-25, 2021, Virtual Event, Sweden
©2021 Copyright held by the owner/author(s). Publication rights licensed to ACM. ACMISBN978-1-4503-8217-5/21/06...$15.00 https://doi.org/10.1145/3431379.3460640
1 INTRODUCTION
Capturing the status of resources in a computing environment is as fundamental as using them. Understanding how resources are used is crucial to users, administrators, and owners for several reasons [54]. For instance, one can achieve a better mapping of compute elements to hardware resources, identify performance bottlenecks, detect faulty hardware, analyze and tune an application's execution, enable hardware-based triggers (e.g., raise interrupts on a hardware condition), and derive accurate client/user pricing based on utilization. However, capturing the state of resources accurately and timely is challenging, especially in a distributed environment [58]. Modern supercomputer architectures demonstrate complex hardware compositions [7, 30, 22] (e.g., multi-tiered storage, compute accelerators, software-defined networks etc.,) that can overwhelm the underlying monitoring services. Further, scientific applications [46, 14, 61] run in large decoupled workflows making it harder for the developers to keep track of resource utilization across a cluster. There is a wide variety of monitoring services that capture, store, and provide access to telemetry data - measurement data that describe the state of a remote resource for a given time window. For example, Ganglia [37] provides distributed and federated access to telemetry data, Lightweight Distributed Metric Service (LDMS)[1]candetectfeatures and events of user interest on meaningful timescales, TOKIO [36] collects and analyzes different aspects of a system resources to understand possible bottlenecks, and lastly, Automatic Library Tracking Database (ALTD) [21] can track linkage and execution information of applications. These monitoring services help scientists, system administrators, and machine owners understand how resources are allocated, deployed, and utilized across applications and through time. Through offline analysis of telemetry data, resource monitoring can guide performance tuning, track architectural development, and even inform future machine purchases or upgrades.
Real-time access to telemetry data is critical to application and middleware library developers for ensuring behavior correctness and optimizing performance. For instance, modern multi-tiered distributed buffering platforms, such as Hermes [30], leverage tier capacity and load information to guide their data distribution policy. For every buffering request at a given timestamp, Hermes needs to know:a)theremainingcapacityofthestoragetierstoensurethatthe incoming data can fit in the buffers, and b) the load of each participating buffering node to find the optimal buffering placement scheme. Similarly, data prefetchers [20, 52] need to know the current prefetching cache size to optimally fetch new data expected to be read soon while reducing the cache pollution. As another example, I/O schedulers [31] leverage information about the current load of a resource to better balance the load across a collection of distributed elements. For every incoming client connection/request, such algorithms need to direct traffic to the least busy node. Similarly, an MPI application
can distribute work across all ranks based on the current CPU and main memory load on the host machines [1]. Lastly, coordination mechanisms such as leader election algorithms [45] require the set of available resources to achieve an optimal point of synchronization and coordination. Similarly, fault detection techniques [50] require the set of degrading nodes to successfully predict faults. Further, malleable storage systems [28] require a list of available resources to be able to expand their footprint to additional machines. The above examples highlight how important is to access telemetry data accurately and timely to achieve optimized and correct solutions.
In this study, we highlight some critical features of distributed monitoring services. First, to make optimal decisions, applications need near-real time access to telemetry data that accurately reflect the current status of the monitored resources. Typically, existing monitoring services use file systems or relational databases to store telemetry data. However, these storage backends were not designed to provide any additional functionality for time-series datasets, and thus, do not efficiently support the I/O characteristics of a monitoring service: fast ingestion of monitoring events and low-latency random access of historical data. Second, telemetry data (i.e., raw metrics from hardware) often cannot be utilized by the application directly [6]. Additional processing and data transformations typically occur to produce higher-level information about the status of a distributed computing environment. For example, a typical query might be: get the total remaining capacity of a subset of nodes in a cluster that are equipped with tier 1 storage devices. These type of questions demand an advanced querying engine to achieve complex data transformations, such as metric aggregation, filtering, or ordering. Since these operations are executed on-demand [26], a further increase in access latency is expected. Parallel query resolution and efficient pre-processed enriched metadata can alleviate this issue and offer a higher level of sophistication in telemetry data. Third, resource monitoring is costly due to the additional overhead of polling the resources and the potential interference with the running application. High-resolution monitoring (i.e., high polling frequency) may lead to increased accuracy of capturing the status of resources but with an additional cost. In contrast, by relaxing the resolution, monitoring services trade accuracy with performance. One way to better balance this, is to use a dynamic - instead of a static - polling frequency. In other words, a monitoring service should tighten the frequency of resource polling when a significant change in status is detected and relax it otherwise. Lastly, general purpose monitoring services such as Ganglia [37] have a very wide scope of what kind of resources they can monitor. Even though this is a great capability, generality may hurt the accuracy, resolution, and quality of monitoring data (i.e., breadth and depth of low-level hardware metrics). Domain-specific monitoring is necessary when one wishes to acquire a curated set of information of a certain type of a resource.
To address the above challenges, we introduce Apollo, an ML-assisted, real-time, and low-latency monitoring service. Apollo focuses on monitoring the storage subsystem of a distributed computing environment, but ideas presented here can be easily replicated for other domains as well. Apollo supports fast ingestion and low-latency access to metrics by a custom distributed data structure, called Storage Condition Report (SCoRe), that leverages a data streaming approach and a publish-subscribe delivery paradigm. With SCoRe as its internal repository of collected metrics, Apollo uses an advanced query engine that can resolve queries in parallel and in-situ while maintaining a highly curated list of I/O-specific metrics. Since Apollo is a storage resources observer, a comprehensive list of I/O Insights is presented to help guide optimizations in I/O scheduling, data placement, and workload distribution. These insights can further motivate application and middleware library developers to build new resource-aware algorithms that would improve the performance [43]. Lastly, to lower the cost of monitoring while maintaining high accuracy of monitoring information, Apollo first adopts a dynamic monitoring approach where measurement intervals are relaxed or tightened based on the change in state. To further improve the responsiveness and accuracy of the collected metrics, Apollo adopts a new machine learning model, called Delphi, that is trained to provide predicted values of a metric within polling periods. The combination of SCoRe, I/O Insights, and Delphi allows Apollo to offer a highly flexible service that provides high-resolution information to resource-aware applications with low system overhead. Apollo demonstrates the following contributions:
- (1) Stale monitoring data is useless data! It is critical for telemetry data to be delivered on time to accurately capture the current status of the resources. To address this, this paper presents the design and implementation of SCoRE (§3.2), a fast ingestion and low-latency data structure optimized for telemetry data.
- (2) Raw monitoring data is useless data! Low-level hardware counters demonstrate limited value to application developers and require specialized knowledge to extract meaningful information about the monitored resource. To address this, this paper presents a collection of highly curated I/O Insights (§3.3 that transform raw metrics into high-level user-friendly knowledge.
- (3) A costly monitoring service is useless! High-resolution monitoring leads to increased accuracy of telemetry data but demonstrates high overheads. To lower the cost of resource monitoring while maintaining high accuracy of telemetry data, this paper presents two key ideas: a) dynamic polling frequency (§3.4.1), Apollo adapts its polling frequency based on a configurable threshold in change in status. b) Delphi predictive model (§3.4.2), Apollo uses ML techniques to forecast intermediate metric values within polling periods.
2 BACKGROUND AND MOTIVATION
2.1 Existing Monitoring Services
Resource monitoring is vital to know how the system resources are used. It is done extensively in High Performance Computing (HPC) [37, 1] and Cloud environments [62]. These services are aimed to provide system administrators with visualizations of the resource status and enable offline analysis. As of late, middleware services and distributed applications [30, 20, 19, 29, 52] can make use of telemetry data to aid them in their decisions. These services always need an up-to-date view of the system resources, be it remaining capacity or load on a storage resource or the overall load of a node in the system, to make optimal decisions. However, the existing monitoring tools cannot provide a recent view of the system for these applications and middleware services to make optimal decisions, as monitoring services have been designed from a system administrator perspective or from the perspective of a scientist looking to optimize their code. In order for monitoring to be effective for these applications and services, they need a constantly updated view of the system at a much higher resolution than existing tools; otherwise it can lead to sub-optimal decisions. To support this high resolution monitoring, existing data stores need to be capable of ingesting and querying large amounts of data from these middleware services. Currently, this telemetry data is stored in a centralized database [13, 9], like PostgreSQL and Neo4J. This, however, is ineffective and can lead to bottlenecks as they cannot support the high ingestion and querying requirements of this high resolution resource monitoring needed by middleware services and applications. This shift in the need for monitoring from a user-centric view to an application-centric view motivates us to create a new type of I/O backend for monitoring purposes that can support high ingestion and querying rates using a Pub-Sub paradigm and using a decoupled and embarrassingly parallel architecture that can keep up with the monitoring demands of middleware services and other applications.
Inevitably, resource monitoring creates overheads. There is a trade-off between the monitoring overhead and the resolution of monitoring. Coupled with the increased monitoring needs of middleware services and applications that need a fresh view of the system, there should be a balance between monitoring and the overhead it creates. Using a fixed time interval, as proposed by Eugen et al. [9] and Vishwanath et al. [55], has 2 main problems. A small monitoring interval can either lead to unwanted interference on the system and can ultimately slow down the job running. While with a large monitoring interval the information collected can be too stale for applications and middleware services to effectively make optimal decisions. Since there is a trade-off between accuracy and cost. As I/O has significant bursty behavior and is known to be generated in phases [38], this motivates us to adopt an adaptive and dynamic monitoring interval that can shrink the interval when the system is dynamic, keeping track of the changes in the system, and stretch the interval when the system is static, within a threshold, reducing the cost of monitoring when there is no major change happening to the system. This reduces the overall overhead of monitoring based on the changes in the system.
As hardware has gotten more and more powerful over the years, there has been a surge in the use of machine learning techniques to aid various applications [61, 5, 48]. These models provide predictions which provide valuable insights of what could happen. Additionally, telemetry data can be represented as a time-series and so machine learning techniques [47] and time-series analysis [42] can be used to create a machine learning model that can further reduce the overhead of polling the system for monitor data by using this model to predict values between polling intervals, further reducing the overhead of monitoring while providing high resolution telemetry data. There is a motivation to reduce the overall overhead of high resolution monitoring by using adaptive intervals to balance the cost of monitoring and maintaining an updated view of the system. There is also a motivation to use a machine learning model where the cost of prediction is lower than the cost of polling the system. These two techniques will be used to reduce the overall cost of monitoring the system while simultaneously providing high resolution telemetry data.
2.2 Predicting Time-series Data
Telemetry data is time-series data which can be modeled using Machine Learning (ML) techniques such as Deep Long short-term memory (LSTM) models [47]. These models aim to capture the different intricacies of the features using a cell which stores values over arbitrary time intervals and use input, output, and forget gates to regulate the flow of information into and out of the cell. There are other models that use Convolutional Neural Networks (CNNs) [48] which take advantage of the hierarchical pattern in data and create more complex patterns using smaller, simpler patterns. They have been shown to work as well as Recurrent Neural Networks (RNNs) for time-series forecasting [5]. However, these models are unsuitable in environments that have limited resources and consequently for environments that have low overhead requirements [39]. Additionally, these models are extremely specific to the individual metrics they are trained on and often expensive in inference. These characteristics make them unsuitable for building a low-latency monitoring service. This work proposes a novel methodology to create a lightweight and effective model by using understanding of time-series datasets from Morill et. al. and neural network models catered to lowering the requirements for low overhead environments.
3 APOLLO
Applications and middleware services require telemetry data provided by monitoring services in order to determine data placement, perform synchronization, manage resources, etc. To do so, they require low-latency access to metrics in order to make informed decisions based on a highly-detailed view of the cluster. Additionally, modern middleware services require aggregations of metrics to derive valuable insights to drive optimization decisions. To this end, Apollo is a near-real-time monitoring service which is tailored to serve highly concurrent queries generated by middleware services. Moreover, Apollo provides I/O-specific insights which are curated to meet the complex storage status demands of modern middleware services [30, 29]. Apollo's design encompasses the following principles: a) Reducing telemetry data access latency while increasing I/O throughput: Apollo aims to provide middleware services with low-latency access to monitoring metrics in order to give them the latest view of the cluster status. That is, Apollo should utilize a decoupled and embarrassingly parallel computation paradigm to enable near-real-time maintenance/serving of telemetry data. Additionally, middleware services require high-level I/O metrics [30, 29] aggregated at different levels to perform their tasks efficiently. Hence, Apollo should provide a framework where low-level I/O metrics (e.g., disk queue size, disk capacity, etc.) can be efficiently converted into high-level insights (e.g., load of the storage resource, or total remaining capacity of an NVMe tier). b) Reducing overall cost of resource monitoring while increasing accuracy: monitoring status for a distributed and multi-tenant cluster is complex due to the change in optimal granularity of monitoring over time. Apollo aims to use an adaptive and dynamic interval (i.e., the interval of monitoring changes over time) to adapt to this dynamic nature of the cluster and reduce the cost of monitoring while also providing high resolution telemetry data when needed. Additionally, Apollo also uses a machine learning model called Delphi to increase the resolution of monitoring by predicting intermediate values and can hence further reduce the overall cost of monitoring.
3.1 High Level Architecture
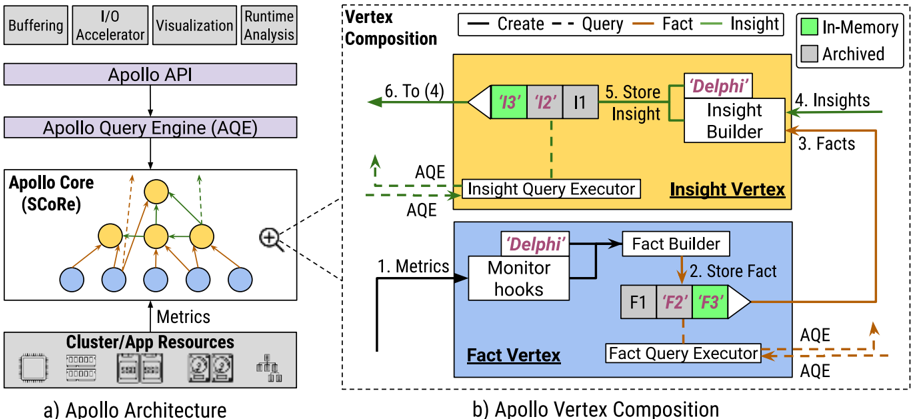 Fig. 1. Visualization of the High Level Architecture for Apollo.
Sub-figure 1(a) presents the overall architecture of Apollo. Apollo's core responsibility is to provide an end-to-end infrastructure to maintain and serve the current status of the Cluster/Application Resources. To achieve this goal, Apollo utilizes SCoRe to enable low-latency accesses to telemetry data. SCoRe is a distributed data structure represented as a Directed Acyclic Graph (DAG) of vertices, where each vertex collects Information from Apollo. Information is characterized into two types: Fact and Insight, they are stored as a tuple along with (timestamp, fact/insight, predicted/measured(0/1)). A Fact is the smallest unit within Apollo. Facts represent the value of a given Metric that has been captured from a particular hardware or software resource. The Fact Vertices hook into different cluster resources and extract Metrics from them. An Insight is a high-level combination of one or more Facts and/or Insights. Some examples of Insights include the total available memory in the cluster, the aggregated CPU performance of a group of compute nodes, the remaining capacity of SSD drives, etc. Users can also instrument their code and register/unregister custom Fact and Insight vertices during the runtime of their application. In the figure, Fact Vertices are the sources whereas Insight Vertices form the Sinks and Inner Vertices of SCoRe. The Vertices of SCoRe are distinct processes in the cluster that create, store, and serve their Information. Middleware services query Apollo through the use of the Apollo Query Engine (AQE), which resolves queries into multiple accesses within SCoRe. The Insight and Fact Vertices utilize the stream-paradigm [51] for data movement. This paradigm enables the overlap of operations within vertices with the Information movement within Apollo.
Sub-figure 1(b) presents the flow of Information through the aforementioned vertices of SCoRe. It starts from the Fact Vertices which capture Metrics from Cluster/Application Resources. This data flow is labeled as 'Create' in the figure. The Fact Vertices capture these Metrics with an adaptive and dynamic monitoring interval using the Monitor Hook (1). The Monitor Hook sends this Metric to the Fact Builder, which converts the Metric into a Fact. This Fact is linearized and published (2) onto the Fact Queue, a simple queue. The Facts are ordered by timestamp, making them linearizable and removing the need for a priority queue. Facts from the Fact Queue can be consumed by an Insight Vertex to generate new Insights (3). The Insight Vertex can consume Facts (3) and/or other Insights (4) and convert them into new Insights in the Insight Builder. Similar to a Fact Vertex, the Insight Vertex pushes Insights (5) into an Insight Queue, which later can be consumed directly (6). Each Fact and Insight vertex holds a dedicated, in-memory queue and Archiver, which is both efficient and scalable and stores the queue in a log. The Monitor Hooks and Insight Builder are enhanced with an ML inference model, called Delphi, that predicts Facts for Fact Vertices and Insights for Insight Vertices between the monitoring intervals to increase the granularity of measurements, which further increase the resolution of the telemetry data. Time granularity differences between metrics motivate the use of a pull mechanism in order to achieve low-latency and durable results, each metric in a node is stored in a unique queue, as in-memory queues are scalable and efficient. Finally, the middleware services can query Apollo via the AQE, which uses algorithms similar to state-of-the-art query engines such as Presto [49], converts a client query into multiple Information access calls which are served by the Query Executor of that Vertex. The executor parses the queue (or the persisted log for evicted entries) using timestamp-based indexing to perform the requested queries. This translates to highly parallel and decoupled access to information within the Apollo service.
3.2 Improved Storage Layer
3.2.1 Storage Condition Report (SCoRe). SCoRe is the core data structure of Apollo. It is a distributed data store based on a graph structure, and serves data with low latency. Its main responsibilities are to collect the telemetry data, maintain facts, generate insights, and service various middleware libraries or clients. The distributed graph design structure uses a Pub-Sub communication fabric that enables it to support highly concurrent telemetry data access with low latency. It uses libuv [34] for asynchronously setting and manipulating intervals between monitoring hook accesses, and Redis Streams [25] for maintaining telemetry data in a queue and providing the Pub-Sub communication paradigm.
SCoRe has two key components: Fact Vertices and Insight Vertices. The vertices are implemented using concurrent lock-free queues [18]. Facts are collected and then added into its queue. Fact Vertices act as the source in SCoRe. The Insight Vertex builds insights and adds them to its queue, similar to the fact vertex. Facts and Insights are added only if there is a change from their previous value. Once in the queue, the Fact or Insight can be serviced immediately. The distributed graph-based design of SCoRe can be mathematically modeled to calculate its time complexity. Let 𝑓(𝑋) be a function used to calculate an Insight using the Information vector 𝑋. ℎ is the height of the DAG and 𝑉 be the number of vertices. Each parameter 𝑥𝑖 ∈ 𝑋 can have a Hamming Distance up to ℎ from the vertex generating the insight. Thus, in the worst case, the cost of propagating insights from the source to destination is O(𝑝 ∗ ℎ), where 𝑝 ≤ 𝑉.
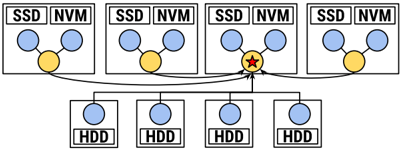 Fig. 2. A simple use case of Apollo.
Figure 2 showcases a simple use case of SCoRe, where a middleware service desires information about the total storage space available in all nodes of the cluster. Each compute node possesses an NVMe and SSD device. Each storage node contains an HDD. As such, two Fact Vertices get deployed in every compute node and one in each storage node. The Fact Vertices monitor the available space on the mount point for both storage devices and add the Facts into their respective queues. A similar deployment is made on the storage nodes. The middleware can then request through AQE the status of any individual device. Additionally, four Insight Vertices are deployed in the cluster, where three of them are in charge of subscribing to the individual streams of all devices in the same node and aggregating data for their Insights into their respective Insight Vertices. The final Insight Vertex will subscribe to the other Insight Vertices and continually generate a combined view of the total space available in the cluster.
3.3 I/O Insight Curation
Middleware services [30, 29, 28] require I/O-specific insights in order to make data placement, computation placement, and resource allocation decisions. Insights have been curated from popular I/O algorithms that can be categorized into: Performance, Energy, Access, and Workflow info. These insights are motivated from a variety of middleware libraries that need specific information about the resource performance or load and other aspects of the job. These insights provide high-level knowledge about the resource while encompassing various other factors. To come up with these Insights required looking at various middleware services [30, 29, 20, 19, 23] and reverse engineering insight curations that would be useful for them as well as developing ideas with a clear relationship to the insight categories determined above. Details of a few of these insights is provided in Table 1. For example, in relation to the performance category, there is an 'Interference Factor', which indicates the degree to which the I/O is being interfered with. This is an insight that could be used by an I/O scheduler to find the device that has the least amount of I/O interference and is capable of accepting more I/O. For the Access category, a Node Availability List is maintained which is useful for leader election algorithms where there is a need to know which nodes are currently online. This metric can reduce the time to perform the election as Apollo already knows which nodes are online. For the Energy category, there is Energy Consumption per Transfer, which has been designed to indicate the amount of power the node is using vs the amount of work the node is doing. With this a resource allocator may decide to decommission resources that have high energy consumption per transfer and move their workloads somewhere else. For Workflow Info, there are Allocation Characteristics. For these, Apollo uses metrics provided by Slurm. This information can be gathered using various Slurm commands. With these insights, Apollo provides easy hooks to get this information which otherwise would be tedious for most middleware libraries.
3.4 High Accuracy With Low Monitoring Cost
3.4.1 Adaptive and Dynamic Monitoring Interval. Middleware libraries are required to have up-to-date information about the various metrics that a monitoring service like Apollo can provide. While polling each metric, a balance needs to be made between polling frequency and overhead. Polling at a high frequency can present a significant bottleneck while polling less often always presents a risk that they could miss vital information. It would be more effective to poll less often when there is little change in a particular metric, and more often when the metric is changing rapidly, in order to provide reasonably up-to-date information when requested without incurring a significant monitoring cost. In addition, there is always the possibility that the optimal polling interval for any given metric could change due to changing patterns, so the monitoring service needs to be able to adapt to that change as it occurs [57].
In Apollo, there were two main techniques explored in order to capture the optimal polling interval of a workload. The techniques that utilized include the simple parameterized method and the adaptive parameterized method. The simple parameterized method is based on the Additive Increase, Multiplicative Decrease (AIMD) method [17]. The idea behind this is that when the change in metric value is within a certain user-defined threshold, Apollo can consider the value effectively close enough and increase the interval by an additive constant, when the change in metric value is not within this threshold Apollo must decrease the value in a multiplicative fashion. The adaptive parameterized method is an optimization of the simple parameterized method, where instead of using a single change to determine how close the value is to optimal, Apollo utilized a difference from a rolling average of changes. This adaptive technique ensured that changes would be accounted for by their difference from the expected change rather than their difference from a recent value, which provided the benefit of accounting for non-continuous metrics which bounced repeatedly between two or more discrete value groupings, something that the original algorithm had a difficult time accounting for and which was found to be a common case in certain real metrics.
3.4.2 Relaxing Measurements through Delphi.
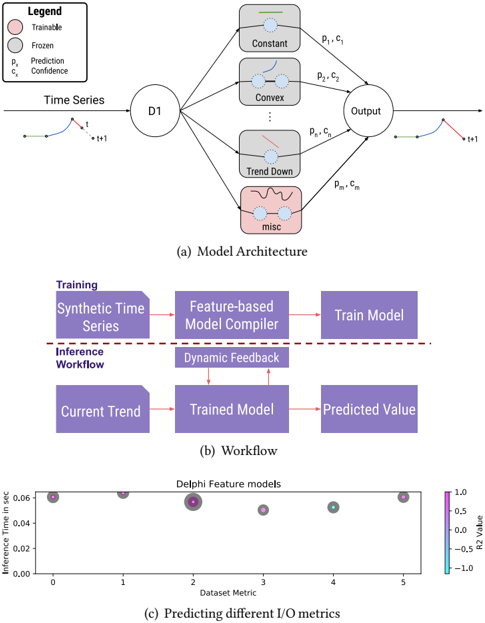 Fig. 3. The Delphi predictive model.
Delphi is a key component in Apollo. It aids in reducing the monitoring interval of Apollo by utilizing machine learning techniques. Delphi utilizes a Neural Network (NN) model to predict intermediate values between two measurements. This allows Apollo to always have the latest view of the resource without making the monitoring process too expensive. Telemetry data is represented as time series data [47]. Therefore, Delphi applies time series analysis to model the metrics of interest. When creating the model Delphi needs to ensure that the model's inference cost and overheads are lower than that of monitoring the resource. Delphi Methodology: Delphi is designed with the intuition that time-series data is made of eight key features [35]. We experimented by creating a synthetic dataset of these eight different features found in time-series data and trained a lightweight, one-Dense layer neural network on each of the features with a window size of five. We then created a synthetic test dataset to ensure that the models could accurately predict for their specific features. We noticed that it was possible for these models to accurately predict for their specific feature. So, we then stacked the models as seen on Sub-figure 3(a).
We set these pre-trained feature models to be untrainable [4] (i.e., the weights of mathematical model are fixed and non-trainable) while stacking it as seen in the figure. Then we add a one-Dense trainable layer that could learn any other missing features and subsequent noise that can be in the data. We then trained this model with a synthetic dataset comprised of the different features. During this process, the model learns how to combine the predictions of the different models based on their different confidence scores and gives the appropriate prediction. These models were built and trained using TensorFlow, with the C API utilized to merge it with Apollo. Delphi Verification: In order to verify the model for Delphi, the model was trained on different synthetic datasets and tested against different I/O metrics. In Sub-figure 3(c), the size of the bubble is the mean absolute error, the x-axis shows the different datasets it was tested on. In this figure, different metrics are reflected along the x-axis, while the y-axis shows the inference cost of a given model for a particular metric and the size of bubble reflects the mean absolute error of that model. The figure shows that the model performs well for the different I/O metrics and is at least comparable to a model that has been trained explicitly for the metric. This test is done to show that Delphi is a low cost model that has been trained on a set of simple synthetic datasets and can predict metrics it hasn't been trained for.
4 EVALUATION
4.1 Methodology
- 4.1.1 Testbed. We ran our experiments on the Ares cluster at the Illinois Institute of Technology [24], consisting of 32 compute nodes and 32 storage nodes interconnected by a 40Gb/s Ethernet network with RoCE enabled. Each compute node consists of a dual Intel(R) Xeon Scalable Silver 4114 (i.e., 40 cores per node), 96GB RAM and a local 250GB NVMe. Each storage node has a dual AMD Opteron 2384 (i.e., 8 cores per node), 32GB RAM, a 150GB SATA SSD and 1TB HDD. The cluster runs on CentOS 7.1 and the MPI library version is MPICH 3.3.2 and use TensorFlow 2.3.1 for training the machine learning models.
- 4.1.2 Workloads. To evaluate Apollo, we performed two sets of evaluations. The first, a set of evaluations of the internal components of Apollo exploring the three major components: SCoRe, Adaptive Interval Module, and Delphi. We then evaluate the capabilities of the data structures and the communication layer. For the second component, we evaluate the Dynamic Monitoring Interval by exploring the system overhead it generates and the accuracy and performance of the new approach. The final component is Delphi, where we evaluate the model accuracy of the ML model for other time-series data, and quantify how it reduces the overhead of monitoring. Finally, we test Apollo against a monitoring competitor, LDMS, which is widely used in many supercomputers [60]. To do so, we will make use of an HCompress [19] middleware library use-case which requires I/O information and modify it to work under both systems. We then measure the execution time of applications working under the middleware system and the overhead generated by the two monitoring services.
4.2 Reducing Telemetry Data Access Latency While Increasing I/O Throughput
4.2.1 Operation Analysis.
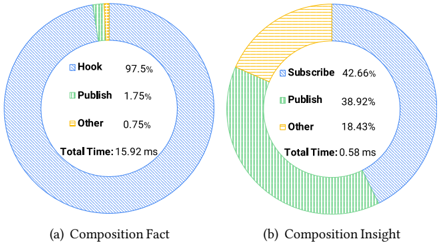 Fig. 4. Visualization of percentage of time spent on each internal component.
Figure 4 presents the anatomy of operations in the two types of SCoRe vertex: Fact and Insight. For the
Table 1: I/O Curators
| I/O Curations | Definition | Formalization | Use Cases | |
|---|---|---|---|---|
| 1 | Medium Sensitivity to Concurrent Access (MSCA) Current Device Interference | Indicates amount of concurrent I/O a device can handle (DevC). | 𝑁𝑢𝑚𝑅𝑒𝑞𝑠 𝐷𝑒𝑣𝐶 ∗ 𝑀𝑎𝑥𝐵𝑊 - 𝑅𝑒𝑎𝑙𝐵𝑊 𝑀𝑎𝑥𝐵𝑊 | AnI/O scheduler can find the device that is well-suited for handling concurrent I/O [31, 33, 53] |
| 2 | value (Interference Factor) | Indicates the degree to which I/O is being interfered with. | 𝑅𝑒𝑎𝑙𝐵𝑊 𝑀𝑎𝑥𝐵𝑊 | AnI/O scheduler can find the device that can accept more I/O [31, 33, 53] |
| 3 | FS Performance | Performance characteristics of filesystems in the cluster | compression type, block size, RAID level, #devices,MaxBW | DPEs can place data on fast devices or devices with compression enable [19, 30, 56] |
| 4 | Block hotness | measure of how often a block is accessed | (BlockID, frequency of access) | Middleware libraries [30, 20] can use block hottness to prefetch data appropriately |
| 5 | Device Health | The current health of a device | 1 - 𝑁𝑢𝑚𝐵𝑎𝑑𝐵𝑙𝑜𝑐𝑘𝑠 𝑇𝑜𝑡𝑎𝑙𝑁𝑢𝑚𝐵𝑙𝑜𝑐𝑘𝑠 | DPEs can place important data on healthy devices [30, 56, 59] DPEs can use this information to place |
| 6 | Network Health | ping time between 2 nodes | (timestamp, nodeID-1, nodeID-2, ping time) | data in nodes with high network responsiveness [30, 56, 59] |
| 7 | Device Fault Tolerance | Fault tolerance of a device | 𝑅𝑒𝑝𝑙𝑖𝑐𝑎𝑡𝑖𝑜𝑛𝐿𝑒𝑣𝑒𝑙 𝐷𝑒𝑣𝑖𝑐𝑒𝐻𝑒𝑎𝑙𝑡ℎ | DPEs can place important data on more fault-tolerant devices. [30, 56, 59] |
| 8 | Device Degradation Rate | The health of a device vs the amount of blocks read/written over the lifetime of the device. | 𝑑𝑒𝑣𝑖𝑐𝑒 _ ℎ𝑒𝑎𝑙𝑡ℎ 𝑡𝑜𝑡𝑎𝑙 _ 𝑏𝑙𝑜𝑐𝑘𝑠 _ 𝑟𝑒𝑎𝑑 + 𝑡𝑜𝑡𝑎𝑙 _ 𝑏𝑙𝑜𝑐𝑘𝑠 _ 𝑤𝑟𝑖𝑡𝑡𝑒𝑛 | DPEs can place important data on devices that are not expected to degrade anytime soon.[30, 56, 59] |
| 9 | Node Availability List | Ordered list of nodes which are currently online | (timestamp, list of all the available node) | Leader election algorithms need to know which nodes are currently online [2, 12] |
| 10 | Tier Remaining Capacity | The amount of capacity available in a tier | ˝ 𝑖 < = 𝑛 𝑖 = 0 𝐷𝑒𝑣𝑖𝑐𝑒𝐶𝑎𝑝𝑎𝑐𝑖𝑡𝑦 𝑖 - 𝐶𝑎𝑝𝑎𝑐𝑖𝑡𝑦𝑈𝑠𝑒𝑑 𝑖 | DPEs may decide to drain the data to a lower tier once a tier reaches a threshold. [30, 56, 59] |
| 11 | Energy Consumption per Transfer | Indicates the amount of power a node is taking to perform I/O | 𝑃𝑜𝑤𝑒𝑟𝑃𝑒𝑟𝑆𝑒𝑐 𝑇𝑟𝑎𝑛𝑠𝑓 𝑒𝑟𝑠𝑃𝑒𝑟𝑆𝑒𝑐 | Decommission resources that are not doing a lot of work [27, 40, 32] |
| 12 | System Time | Request from system (e.g. 'date' call or chrono::now()) | (NodeID, system time) | Systems that use the system time and calculate drift to coordinate and use physical time more effectively [28] |
| 13 | Device Load | Indicates the amount of I/O a device is doing | 𝐵𝑙𝑘 _ 𝑟𝑒𝑎𝑑 / 𝑠 + 𝐵𝑙𝑘 _ 𝑤𝑟𝑖𝑡𝑡𝑒𝑛 / 𝑠 𝐵𝑙𝑘 _ 𝑟𝑒𝑎𝑑 + 𝐵𝑙𝑘 _ 𝑤𝑟𝑖𝑡𝑡𝑒𝑛 | DPEs can place data on devices that are under less stress than others. [30, 56, 59] |
| 14 | Energy Consumption Per Transfer | Indicates the amount of power the node is using vs the amount of I/O the node is doing. | 𝑝𝑜𝑤𝑒𝑟 / 𝑠 𝑡𝑟𝑎𝑛𝑠𝑓 𝑒𝑟𝑠 / 𝑠𝑒𝑐 | Decommission resources that are not doing a lot of work [27, 40, 32] |
| 15 | Allocation Characteristics | Information about the resources that a particular job is using | (timestamp, #nodes, distribution of processes, bytes read/written by jobs) | Dynamic resource allocator needs to know the resources provisioned [27, 11] |
test, we deployed one Fact Vertex representing the capacity metric and one Insight Vertex, which derives an insight from the Fact Vertex. The test ran locally on a single node in Ares. We need to have low overhead for different components of SCoRe and have a service that can send data with low latency and ensure that the performance is bounded by the monitoring hook rather than by the queue structure. We measured the percentage of time spent in different operations for the Fact Vertex and Insight Vertex. Sub-figure 4(a) shows us that 97.5% of the time is dominated by the monitoring hook while the publish operation only costs 1.8% on the Fact Vertex and Sub-figure 4(b) shows the percentage of time spent in different operations for the Insight Vertex. Note that the 'Other' category in this figure showcases a combination of thread management combined with the computation of the Insight. We see that SCoRe as a data structure is high performant while providing low latency and is not a bottleneck for the service.
4.2.2 Overhead Analysis.
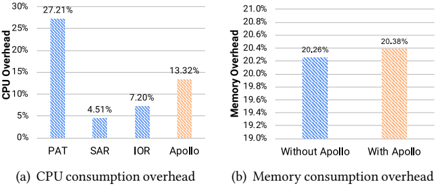 Fig. 5. Apollo resource consumption and overhead.
Although Apollo performs well and can provide near real-time metric access and adaptive monitoring cost, it inevitably generates some overhead on the node when collecting data and serving the middleware layer. Thus, we need to evaluate its overhead on CPU and Memory to show the impact that it has on the node. We use IOR to simulate different workloads in two situations: running IOR without Apollo and running IOR together with Apollo. At the same time, we use Performance Analysis Tool (PAT) developed at Intel [3], to track CPU and memory usage of Apollo on different nodes. The breakdown of CPU usage can be seen in Sub-figure 5(a). It shows that the Apollo node executables account for 13.32% of the CPU overhead. The remaining overhead includes the IOR application that we ran, which accounts for 7.2%, and various monitoring services from PAT itself. Of these modules, System Activity Report (SAR) accounts for 4.51%, while PAT as a whole, incorporating SAR, perf, grep, and ps subsystems, accounts for 27.2%. In light of this, we see that Apollo is more lightweight than the PAT tool we used to track the results, though not as lightweight as the SAR tool, which directly accesses metrics, or the IOR application workload we ran. A comparison of average memory utilization with and without Apollo can be seen in Sub-figure 5(b). It shows a very similar memory footprint with and without Apollo. The memory overhead of Apollo is on average less than 0.1% of total memory of an Ares node, or about 57MB.
4.2.3 Throughput Analysis.
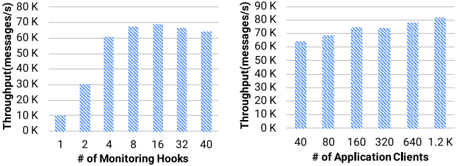 Fig. 6. Throughput of write and read Operation.
In SCoRe, we need to test its scalability and performance to establish the upper bound of the performance of the whole service. To do so we evaluate the performance of the publish and subscribe operations in different scenarios: scaling the number of client threads, scaling the metric size, and scaling the queue thread counts. To evaluate the publish throughput with varying client threads, we launched a SCoRe instance on a node and deployed a client with various thread counts ranging from 1 to 40 on another node. The metric size of the publish operation was set at 16B with the one queue thread. During the test, each client thread continuously published 1M events to the SCoRe queue. The results are shown in Figure 6. Sub-figure 6(a) shows that SCoRe queue reaches a peak performance of 70K events/s with 16 client threads, beyond which it starts suffering from performance degradation. This is a single node test and increases linearly as we increase number of nodes.
Similarly, we evaluate the throughput of the subscribe operations. In the first case, we deployed SCoRe with one queue thread on one node and deployed clients on different nodes. On each node we launched 40 threads subscribed to a remote queue, we published 16K events of metric size 16B each to the queue in each thread. Subfigure 6(b) shows that SCoRe scales well for 32 nodes and does not cause significant slowdown across the whole service.
4.2.4 Latency Analysis.
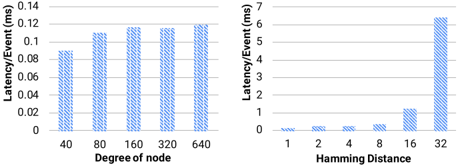 Fig. 7. Change in performance when increasing node degree and hamming distance.
Apollo is required to provide low-latency access for middleware libraries. Hence, it is very important to quantify how performance varies on increasing the degree of a node and how it varies when increasing the Hamming Distance between the source and sink. To quantify the effects of increasing the node degree, we deployed each node with 40 Fact Curators and an Insight Curator on a separate node, which subscribes to all the Fact Curators. During the experiment, we increase the number of nodes between 1 and 16, and measure the client's latency to pull a new Insight from the Insight Curator. The results are shown in Figure 7. Sub-figure 7(a),
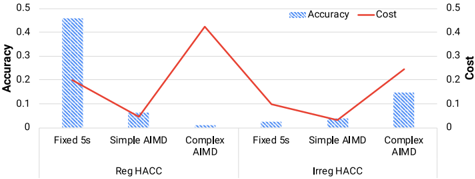
Figure 8: Cost and accuracy of fixed and AIMD-based Adaptivity Models
whichindicates that the latency increases with the increase of degree of the node until it reaches an upper bound. In addition, the cost of handling Facts is much lower than that of monitoring the low-level metrics. To quantify the effects of increasing the Hamming Distance between source and sink, we first deployed 32 hook nodes and each node has one hook on the Fact Vertex. Then we launched different numbers of Insight Curators by increasing the layers of Insight Curators from 1 to 32. When increasing the layers, each layer relies on its previous layer. We deployed a client node to pull data from the top Insight Curator and measured its latency to get the latest value from the service. Sub-figure 7(b) demonstrates latency results in increasing the Hamming distance. We observe that the latency increases when increasing the Hamming distance and notice a spike in the latency at the maximum possible distance.
4.3 Reducing Overall Cost Of Resource Monitoring While Increasing Accuracy
4.3.1 Adaptive and Dynamic Monitoring Interval. In order to verify the performance of our 2 algorithms, we tested them against each otheraswellasagainststaticpollingmethods.WeusedaHACCwrite workload which was tailored with waits to ensure writing 38000 bytes of data to an NVMe every 5 seconds or a random amount of data between 19000 and 38000 bytes to an NVMe every 5-20 seconds, and measured the capacity of the NVMe over time. In order to ensure uniformity, we captured the HACC capacity workload and replayed it with an emulation, so that there would be minimal issues with time drift or interference between runs.In this test, we show the accuracy and costs of various methods of adaptive polling intervals, as well as
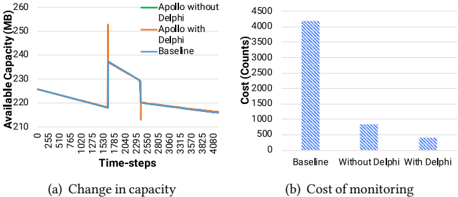
Figure 9: Apollo on irregular HACC-IO workloads
compare them against static polling intervals. To evaluate this adaptive interval, we deploy a Fact Curator with a synthetic monitoring hook, which replays the regular or irregular (random) HACC dataset specified above. We test it with a static interval, an adaptive interval with a rolling average window of size 10 (complex AIMD), and one without a window, which is equivalent to a window size of one (simple AIMD). We played 30 minutes for each adaptivity type and compared it for accuracy and cost to the 1 second monitoring trace. Accuracyhereistheratioofcallswhichwouldmatchthe1secondmonitoring equivalent, where cost is the ratio of the number to the maximum numbermonitoringhookcalls(1wouldbeasmanycallsasa1second monitoring equivalent). Figure 8 describes the cost and accuracy of the models we tested, with a fixed model of 5 seconds, the simple AIMDmodelandthecomplexAIMDmodelshownacrossregular and irregular HACC capacity workloads. The choice between simple AIMDand complex AIMD will depend on the workload, and in this case we see complex AIMD performing very accurately for irregular workloads compared to a static monitoring interval as well as simple AIMD, but with an associated cost. The fixed interval does very well in the regular workload due to it being the ideal interval of choice and shows that for a regular workload a fixed interval could be optimal if the conditions are right, while the simple AIMD model performs alright for the regular workload also, and at significantly lower cost.
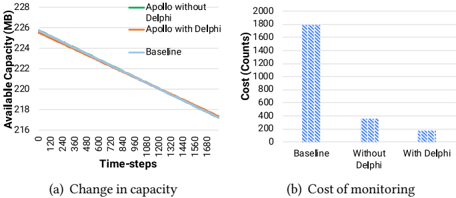
4.3.2 Relaxing Measurements through Delphi. Weneed to quantify the benefit of using the Delphi model. To do so we compare the effectiveness of Apollo with and without Delphi and compare them to a baseline where the capacity was monitored every one second. We ran HACC-IOunderdifferent configurations resulting in regular and irregular workloads. We measured the change in available capacity, underbaseline or ideal conditions (1 second intervals), then using the adaptive and dynamic monitoring interval and finally using both the adaptive and dynamic monitoring interval with the Delphi model. The cost in Sub-figure 9(b) and 10(b) is calculated by keeping track of the number of times the monitor hook was called. Since the cost of calling the hook is mostly constant, higher the number of calls implies higher cost. The change in capacity in Sub-figure 9(a) and 10(a) shows the change in capacities over the course of irregular and regular workloads. From Figure 10 and 9 we see that the predictive model performs reasonably well for a fraction of the cost compared to monitoring as often as possible. This approach provides high resolution telemetry data at a fraction of the cost with only minimal loss of data.
Figure 10: Apollo on regular HACC-IO workloads
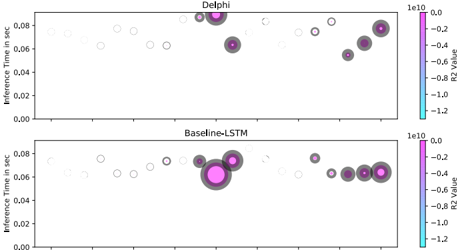
Figure 11: Delphi model vs the baseline model
Weneed to ensure that we have created a general enough model that predicts based on time-series patterns as is verified on Subfigure 3(c). This final model is used to predict the metrics collected. Delphi is then compared against different LSTM models (the baseline) that we trained on their specific datasets. The time it takes to train the Delphi model is roughly 15 minutes vs 3 to 5 hours for the baseline models. In this figure, the size of the bubble is the root mean squared error, the color correlated with the 𝑅 2 value and the centre of the bubble on the y-axis corresponds to the inference time of the corresponding model for a metric. We started by collecting data using SAR [41] while running different workloads using FIO [10]. Wecollected different metrics per drive and partition every second using the '-dbp -P ALL 1' flags on an NVMe, SSD and HDD. We then trained an LSTM model for each of the collected metrics with over 10K collected data points of the dataset and used the other 60K to test the model. We similarly tested Delphi with the different metrics collected. To compare them on their architecture, the Delphi has a total of 50 parameters, of which 14 are trainable and the rest are non-trainable. By contrast, the baseline LSTM model has 71,851 parameters, all of which are trainable. From Figure 11 we observe that the Delphi model can be used on any periodic nonrandom time-series-like data, compared to the baseline models that can only provide respectable inference for the specific metric they are trained for. Note that if a bubble is not clearly visible, the root mean square value of that model is very low and it has a high 𝑅 2 value.
4.4 Real Workloads
(a) Average latency of requests when scaling (b) Query Execution time comparison when scaling query complexity
- (c) Average CPU overhead per process in the 16 node evaluation
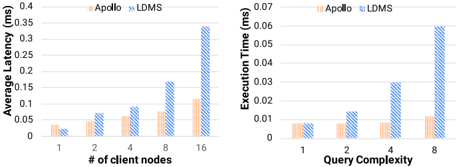
Figure 12: Comparison of Apollo and LDMS
4.4.1 ApolloandLDMS. AcomparisonoftheperformanceofApollo to that of competitors under real situations is important to demonstrate the advantages Apollo offers. For these tests, we benchmark Apollo's performance against the LDMS monitoring service, as it presents a similar but simplified Insight Layer mechanism which allows the service to aggregate results from multiple nodes.
Our service is designed to provide telemetry data to a middleware library or an application. For demonstration purposes, in these tests we use a hierarchical data placement engine [30, 19] as the example middleware library. The middleware accepts I/O requests from an application and makes a decision over what storage layer to place the data on. In our tests, the middleware has access to four storage layers, local memory, local NVMe, a remote shared Burst Buffer (BB) over SSDsandaParallelFileSystemoverHDDs.Wedesignedourtestwith a greedy placement model placing data in the fastest non-full tier.
In order to operate optimally, the middleware service requires an accurate view of the status of the storage resources on the nodes in the cluster to execute the placement of the request. In the experiments, we measured the execution time of the resource query performedbythemiddlewaredata.A resourcequery canbevisualized in Algorithm 4.4.1 and it is created by combining ( UNION operator) of the result of different table accesses. We define the complexity of a query as the number of queried tables which shows the how SCoRe can parallelize the query across different nodes in the cluster.
(a) Apollo+DataPlacement Engine (b) Apollo + Data Prefetching Engine (c) Apollo + Data Replication Engine
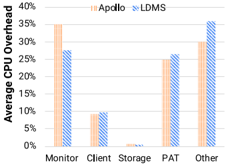
Figure 13: Apollo aiding middleware libraries
- 1 SELECT MAX ( Timestamp ), metric
- 2 FROM pfs_capacity
- 3 UNION
- 4 SELECT MAX ( Timestamp ), metric
- 5 FROM node_1_memory_capacity
- 6 UNION
- 7 SELECT MAX ( Timestamp ), metric
- 8 FROM node_2_availability
- 9 ...;
Resource query example
In Sub-figure 12(a), we observe the change in average execution timewhenqueryingthemonitoringservicewhilescalingthenumber of nodes managed by the middleware service from 1 to 16. The middleware makes use of a static query complexity of 3 (the Parallel File System (PFS) is assumed to always have space). In Sub-figure 12(b), we see that the change in average execution time of querying the monitor service when scaling the query complexity from 1 to 8 (with the number of nodes managed by the monitoring service) is maintained at 16 nodes in all tests. In Sub-figure 12(c), we compare the overhead of Apollo and LDMS when executing it at maximum scale of 16 nodes with a query complexity of 3. From Figure 12, we observe that the latency of Apollo is 3.5x lower than LDMS while only having an overhead of only 7%. For most cases the increase in overhead can be considered to be negligible considering the lower latency and the adaptive interval which ensures we have a more accurate view of the resources on the node while balancing overhead.
4.4.2 Middleware Service with Apollo. Awareness of the status of storage resources is vital to the performance of middleware libraries. In this experiment, we aim to demonstrate the impact of resourceawareness on middleware libraries for real applications. To show this, we run various applications with 2560 processes using different middleware libraries. We run the VPIC-IO [15] kernel, which writes 32MB per process at each time step for 16 time steps. BD-CATS [44] reads the data generated by VPIC-IO. Lastly, Montage [8] is a collection of MPI programs comprising an astronomical image mosaic engine that reads 10MB of data per process at each time step for 16 time steps. We showcase three different middleware libraries: a Hierarchical Data Placement Engine (HDPE) [30], Hierarchical Data Prefetching Engine (HDFE) [20] and a Hierarchical Data Replication Engine (HDRE) [23], all of which are parts of the Hermes middleware ecosystem [30]. The HDPE writes data in fast buffering targets,
allowingthedatatobeingestedquickly.Bydefault,itutilizesaroundrobin data distribution policy for data placement, which can lead to cases where the buffering targets are full and need to be flushed before the new data can be ingested. The HDFE prefetches data from the PFS and stores them in fast prefetching caches, which also utilize a round-robin distribution policy. However, this can result in unnecessaryevictionswhenaprefetchingcacheisfull,leadingtodatastalls when an application attempts to read the evicted data. With Apollo, the HDPE and HDFE can maintain an insight that utilizes metrics tracking the remaining capacity of the different buffering targets or prefetching caches in a list sorted by bandwidth. Therefore, it can guarantee that, for every operation, the data is placed into buffering targets and prefetching caches that have enough capacity, reducing the number of flushes, evictions, and data stalls. The HDRE places replicas of data into different replication sets to allow for higher fault tolerance, reliability, and data availability. By default, this replication engine uses a round-robin data distribution policy to distribute data. This can lead to data stalls if the replication set is out of free space or is too remote from the source. With Apollo, the replication engine can maintain a metric that tracks the remaining capacity of each replication set and the network latency between all the nodes. These metrics can be used to create an insight where replication sets with high remaining capacities and lower network latency are prioritized. Weconfigure each of the middleware libraries to store up to 96GB in NVMe drives and 1TB in Burst Buffers.
From Figure 13, we observe that Apollo can aid various middleware libraries and boost their performance between 10% and 20%. These experiments do not cover every possible use-case for Apollo, but they are indicative of the potential Apollo has to take away the burden of gathering telemetry data efficiently and opens up the opportunity for a new paradigm of systems that are more resourceaware. In Sub-figure 13(a), we see that the HDPE reduces the I/O time of VPIC by 2.3x over simply writing to the PFS. In addition, Apollo is able to improve the performance of the HDPE by 18% over the round-robin policy. By knowing the current capacity of the different buffering targets, the HDPE is able to place data more intelligently among the targets, resulting in fewer flushes and data stalls. Similarly, for Sub-figure 13(b), we see that the HDFE reduces the I/O time of Montage by 33% over simply reading from the PFS and that Apollo is able to improve the performance of the HDFE by an additional 16% over the round-robin policy. This is because, by knowing the current capacity of the different prefetching caches, the HDFE can place data in caches that have enough capacity, resulting in fewer evictions and unnecessary data stalls. Lastly, in Sub-figure 13(c), we see that the HDREincreases the I/O time for VPIC, but decreases the I/O time for BD-CATS, over simply interacting with the PFS. This is because the HDRE writes 3x the amount of data, resulting in worse write performance for VPIC. However, the additional replicas increase the availability of data, improving read performance for BD-CATS. By using Apollo, the performance of both VPIC and BD-CATS using the HDREimprovesby ∼ 12%byplacing replicas into replication sets that have enough capacity to hold the replicas, avoiding unnecessary data stalls. In each of these cases, the applications incur a small ( < 1%) overhead by querying Apollo for the current system state. However, this overhead is outweighed by the benefit to I/O time.
5 RELATEDWORK
To gain insights about the resource requirements of applications and the resource utilization, numerous resource monitoring tools have been developed recently to provide meaningful information. Ganglia [37] and LDMS [1] are two widely used tools in HPC community. Ganglia is a scalable distributed monitoring service for high performance computing systems, which is based on a hierarchical design aimed at federating clusters and aggregating their state. LDMS is a scalable and lightweight monitoring service for large-scale computing systems and applications introduced to monitor the lowlevel metrics and provide useful information to guide development without increasing monitoring overhead and impacting application performance. However, both of them are focusing much on the scalability and maintaining low performance overhead rather than providing low latency data access and high accuracy telemetry data. In one hand, they utilize a user defined fixed interval to collect the low-level metric data. And there always has a trade-off between monitoring cost and accuracy when selecting the interval value. If a coarse-grained interval (one minute or longer) is chosen, it would have low cost but the inaccurate value. If a fine-grained interval (two seconds or lower) is selected, the telemetry data value is more accurate but it also increases the overhead of monitoring. Apollo resolves this problem by using an adaptive and dynamic monitoring interval, which could reduce the overall cost of resource monitoring. To increase the accuracy, Apollo utilizes Delphi, a machine learning model, which could generate predicted value between two measuring intervals. In the other hand, LDMS store the monitoring information into MySQL or flat file storage, and similarly Ganglia uses RRDtool (Round Robin Database) to store and visualize the historical telemetry data, which increases the data access latency. In this work, SCoRe, a distributed data store based on a graph structure utilizing an embarrassingly parallel Pub-Sub streaming paradigm, is utilized to transfer and store telemetry data. This ultimately reduces the telemetry data access latency while increasing I/O throughput.
6 CONCLUSIONANDFUTUREWORK
ThispaperhasproposedApollo,alowlatencyMLassistedmiddlewarecentric monitoring service. It addresses the low latency requirements of middleware libraries using Pub-Sub semantics and can serve data with latency around 0.1ms. It provides a current view of the system resources using adaptive measurement intervals which have been shown to improve the overall accuracy of telemetry data collected compared to static intervals. It further reduces the overhead of monitoring using Delphi, Apollo's ML model that is fast to train, causes significantly less interference, and can predict any nonrandom timeseries data. This paper introduced some I/O Curators to present highlevel metrics that can aide middleware libraries in their decision. It also shows how middleware libraries can use Apollo to offset some of the overheads in decision making while being resource aware. Finally, it shows that, compared to state-of-the-art monitoring libraries like LDMS, Apollo provides lower latency with only 7% extra overhead while maintaining a recent view of the system resources. The experiments shown for Apollo are indicative of the potential in optimizing the collection of telemetry data and show how it can aid middleware libraries to make more optimal decisions. The source code is
available at https://github.com/scs-lab/Apollo for the different components in Apollo. We acknowledge that some of the I/O Curators will need to be tweaked by the user to ensure that the metrics accurately describe what is needed by the middleware library. We could also improve the adaptive interval heuristic by using a more intricate heuristic metric inspired by entropy changes in physics [16]. We could also improve the way monitoring is done using KProbes [55], which can further reduce the minimum monitoring bound.
ACKNOWLEDGMENT
This work is supported by National Science Foundation under OCI1835764 and CSR-1814872.
REFERENCES
[1] A. Agelastos, B. Allan, J. Brandt, P. Cassella, J. Enos, J. Fullop, A. Gentile, S. Monk, N. Naksinehaboon, J. Ogden, et al. 2014. The lightweight distributed metric service: a scalable infrastructure for continuous monitoring of large scale computing systems and applications. In SC'14: Proceedings of the International Conference for High Performance Computing, Networking, Storage and Analysis . IEEE, 154-165.
[2] AArghavani, E Ahmadi, and A. Haghighat. 2011. Improved bully election algorithm in distributed systems. In ICIMU 2011: Proceedings of the 5th international Conference on Information Technology & Multimedia . IEEE, 1-6.
[3] 2020. Asonje/pat: performance analysis tool. Intel, (2020). https://github.com/ asonje/PAT.
[4] G. Awate, S. Bangare, G Pradeepini, and S Patil. 2018. Detection of alzheimers disease from mri using convolutional neural network with tensorflow. arXiv preprint arXiv:1806.10170 .
[5] S. Bai, J. Z. Kolter, and V. Koltun. 2018. An empirical evaluation of generic convolutional and recurrent networks for sequence modeling. arXiv preprint arXiv:1803.01271 .
[6] F. Beneventi, A. Bartolini, C. Cavazzoni, and L. Benini. 2017. Continuous learning of hpc infrastructure models using big data analytics and in-memory processing tools. In Design, Automation & Test in Europe Conference & Exhibition (DATE), 2017 . IEEE, 1038-1043.
[7] J. Bent, G. Grider, B. Kettering, A. Manzanares, M. McClelland, A. Torres, and A. Torrez. 2012. Storage challenges at los alamos national lab. In 2012 IEEE 28th Symposium on Mass Storage Systems and Technologies (MSST) . IEEE, 1-5.
[8] G. Berriman, J. Good, A. Laity, and M Kong. 2008. The Montage image mosaic service: custom image mosaics on-demand. Astronomical Data Analysis Software and Systems ASP , 394, 2.
[9] E. Betke and J. Kunkel. 2017. Real-time i/o-monitoring of hpc applications with siox, elasticsearch, grafana and fuse. In High Performance Computing . J. M. Kunkel, R. Yokota, M. Taufer, and J. Shalf, editors. Springer International Publishing, Cham, 174-186. isbn: 978-3-319-67630-2.
[10] J. Bhimani, J. Yang, Z. Yang, N. Mi, Q. Xu, M. Awasthi, R. Pandurangan, and V. Balakrishnan. 2016. Understanding performance of i/o intensive containerized applications for nvme ssds. In 2016 IEEE 35th International Performance Computing and Communications Conference (IPCCC) . IEEE, 1-8.
[11] L. Bindschaedler, J. Malicevic, N. Schiper, A. Goel, and W. Zwaenepoel. 2018. Rock you like a hurricane: taming skew in large scale analytics. In Proceedings of the Thirteenth EuroSys Conference , 1-15.
[12] A. Biswas and A. Dutta. 2016. A timer based leader election algorithm. In 2016 Intl IEEE Conferences on Ubiquitous Intelligence & Computing, Advanced and Trusted Computing, Scalable Computing and Communications, Cloud and Big Data Computing, Internet of People, and Smart World Congress (UIC/ATC/ScalCom/CBDCom/IoP/SmartWorld) . IEEE, 432-439.
[13] S Bohm, C. Engelmann, and S. L. Scott. 2010. Aggregation of real-time system monitoring data for analyzing large-scale parallel and distributed computing environments. In 2010 IEEE 12th International Conference on High Performance Computing and Communications (HPCC) . IEEE, 72-78.
[14] P. Boyle, M. Chuvelev, G. Cossu, C. Kelly, C. Lehner, and L. Meadows. 2017. Accelerating hpc codes on intel (r) omni-path architecture networks: from particle physics to machine learning. arXiv preprint arXiv:1711.04883 .
[15] S. Byna, J. Chou, O. Rubel, H. Karimabadi, W. S. Daughter, et al. 2012. Parallel I/O, analysis, and visualization of a trillion particle simulation. In Proceedings of the International Conference on High Performance Computing, Networking, Storage and Analysis . IEEE, 1-12.
[16] Y. Cao, W.-w. Tung, J. Gao, V. A. Protopopescu, and L. M. Hively. 2004. Detecting dynamical changes in time series using the permutation entropy. Physical review E , 70, 4, 046217.
[17] D.-M. Chiu and R. Jain. 1989. Analysis of the increase and decrease algorithms 18. for congestion avoidance in computer networks. Computer Networks and ISDN systems , 17, 1, 1-14.
[18] H. Devarajan, A. Kougkas, K. Bateman, and X. H. Sun. 2020. Hcl: distributing parallel data structures in extreme scales. In 2020 IEEE International Conference on Cluster Computing (CLUSTER) , 248-258. doi: 10.1109/CLUSTER49012.2020. 00035.
[19] H. Devarajan, A. Kougkas, L. Logan, and X.-H. Sun. 2020. Hcompress: hierarchical data compression for multi-tiered storage environments. In 2020 IEEE International Parallel and Distributed Processing Symposium (IPDPS) . IEEE, 557566.
[20] H.Devarajan,A.Kougkas,andX.-H.Sun.2020.Hfetch:hierarchicaldataprefetching for scientific workflows in multi-tiered storage environments. In 2020 IEEE International Parallel and Distributed Processing Symposium (IPDPS) , 62-72.
[21] M. Fahey, N. Jones, B. Hadri, and B. Hitchcock. 2010. The automatic library tracking database. Proceedings of the Cray User Group .
[22] A. Fuchs and D. Wentzlaff. 2018. Scaling datacenter accelerators with computereuse architectures. In 2018 ACM/IEEE 45th Annual International Symposium on Computer Architecture (ISCA) . IEEE, 353-366.
[23] A. K. H. Devarajan and X. Sun. 2020. Hreplica: a dynamic data replication engine with adaptive compression for multi-tiered storage. In 2020 IEEE International Conference on Big Data (Big Data) .
[24] IIT. 2019. Ares cluster. http://www.cs.iit.edu/~scs/resources.html#content6-8p. Accessed: 2019-04-24. (2019).
[25] 2020. Introduction to redis streams - redis. redislabs, (2020). https://redis.io/ topics/streams-intro.
[26] R. Izadpanah, B. A. Allan, D. Dechev, and J. Brandt. 2019. Production application performance data streaming for system monitoring. ACMTransactions on Modeling and Performance Evaluation of Computing Systems (TOMPECS) , 4, 2, 1-25.
[27] X. Ji, B. Yang, T. Zhang, X. Ma, X. Zhu, X. Wang, N. El-Sayed, J. Zhai, W. Liu, and W. Xue. 2019. Automatic, application-aware i/o forwarding resource allocation. In 17th { USENIX } Conference on File and Storage Technologies ( { FAST } 19) , 265279.
[28] A. Kougkas, H. Devarajan, K. Bateman, J. Cernuda, N. Rajesh, and X.-H. Sun. [n. d.] Chronolog: a distributed shared tiered log store with time-based data ordering. Proceedings of the 36th International Conference on Massive Storage Systems and Technology (MSST 2020) .
[29] A. Kougkas, H. Devarajan, J. Lofstead, and X.-H. Sun. 2019. Labios: a distributed label-based i/o system. In Proceedings of the 28th International Symposium on High-Performance Parallel and Distributed Computing (HPDC '19). ACM, Phoenix, AZ, USA, 13-24. isbn: 978-1-4503-6670-0. doi: 10 . 1145 / 3307681 . 3325405. http://doi.acm.org/10.1145/3307681.3325405.
[30] A. Kougkas, H. Devarajan, and X.-H. Sun. 2018. Hermes: a heterogeneous-aware multi-tiered distributed i/o buffering system. In Proceedings of the 27th International Symposium on High-Performance Parallel and Distributed Computing , 219-230.
[31] A. Kougkas, H. Devarajan, X.-H. Sun, and J. Lofstead. 2018. Harmonia: an interference-aware dynamic i/o scheduler for shared non-volatile burst buffers. In 2018 IEEE International Conference on Cluster Computing (CLUSTER) . IEEE, 290-301.
[32] C. Li, Y. Wang, Y. Chen, and Y. Luo. 2019. Energy-efficient fault-tolerant replica management policy with deadline and budget constraints in edge-cloud environment. Journal of Network and Computer Applications , 143, 152-166.
[33] W. Liang, Y. Chen, and H. An. 2019. Interference-aware i/o scheduling for dataintensive applications on hierarchical hpc storage systems. In 2019 IEEE 21st International Conference on High Performance Computing and Communications; IEEE 17th International Conference on Smart City; IEEE 5th International Conference on Data Science and Systems (HPCC/SmartCity/DSS) . IEEE, 654-661.
[34] 2020. Libuv/libuv: cross-platform asynchronous i/o. libuv, (2020). https://github. com/libuv/libuv.
[35] J. Lin, S. Williamson, K. Borne, and D. DeBarr. 2012. Pattern recognition in time series. Advances in Machine Learning and Data Mining for Astronomy , 1, 617-645, 3.
[36] G. K. Lockwood, N. J. Wright, S. Snyder, P. Carns, G. Brown, and K. Harms. 2018. TOKIO on ClusterStor: Connecting standard tools to enable holistic I/O performanceanalysis.Technicalreport.LawrenceBerkeleyNationalLab.(LBNL), Berkeley, CA (United States).
[37] M. L. Massie, B. N. Chun, and D. E. Culler. 2004. The ganglia distributed monitoring system: design, implementation, and experience. Parallel Computing , 30, 7, 817-840.
[38] S. Méndez, D. Rexachs, and E. Luque. 2012. Modeling parallel scientific applications through their input/output phases. In 2012 IEEE International Conference on Cluster Computing Workshops . IEEE, 7-15.
[39] P. Molchanov, A. Mallya, S. Tyree, I. Frosio, and J. Kautz. 2019. Importance estimation for neural network pruning. In Proceedings of the IEEE Conference on Computer Vision and Pattern Recognition , 11264-11272.
[40] D. Molka, D. Hackenberg, R. Schöne, and M. S. Müller. 2010. Characterizing the energy consumption of data transfers and arithmetic operations on x86- 64
processors. In International conference on green computing . IEEE, 123-133.
[41] F. Moradi, C. Flinta, A. Johnsson, and C. Meirosu. 2017. Conmon: an automated container based network performance monitoring system. In 2017 IFIP/IEEE Symposium on Integrated Network and Service Management (IM) . IEEE, 54-62.
[42] J. P. Morrill. 1998. Distributed recognition of patterns in time series data. Communications of the ACM , 41, 5, 45-51.
[43] A. Netti, M. Müller, C. Guillen, M. Ott, D. Tafani, G. Ozer, and M. Schulz. 2020. Dcdbwintermute: enabling online and holistic operational data analytics on hpc systems. In Proceedings of the 29th International Symposium on High-Performance Parallel and Distributed Computing , 101-112.
[44] M. M. A. Patwary, S. Byna, N. R. Satish, N. Sundaram, Z. Lukić, V. Roytershteyn, M. J. Anderson, Y. Yao, P. Dubey, et al. 2015. BD-CATS: big data clustering at trillion particle scale. In SC'15: Proceedings of the International Conference for High Performance Computing, Networking, Storage and Analysis . IEEE, 1-12.
[45] M. M. Rahman and A. Nahar. 2010. Modified bully algorithm using election commission. arXiv preprint arXiv:1010.1812 .
[46] T. Ronconi et al. 2020. From cosmic voids to collapsed structures: hpc methods for astrophysics and cosmology.
[47] A. Sagheer and M. Kotb. 2019. Time series forecasting of petroleum production using deep lstm recurrent networks. Neurocomputing , 323, 203-213.
[48] S. Selvin, R Vinayakumar, E. Gopalakrishnan, V. K. Menon, and K. Soman. 2017. Stock price prediction using lstm, rnn and cnn-sliding window model. In 2017 international conference on advances in computing, communications and informatics (icacci) . IEEE, 1643-1647.
[49] R. Sethi, M. Traverso, D. Sundstrom, D. Phillips, W. Xie, Y. Sun, N. Yegitbasi, H. Jin, E. Hwang, N. Shingte, et al. 2019. Presto: sql on everything. In 2019 IEEE 35th International Conference on Data Engineering (ICDE) . IEEE, 1802-1813.
[50] J. Sloan, R. Kumar, and G. Bronevetsky. 2012. Algorithmic approaches to low overhead fault detection for sparse linear algebra. In IEEE/IFIP International Conference on Dependable Systems and Networks (DSN 2012) . IEEE, 1-12.
[51] R. Stephens. 1997. A survey of stream processing. Acta Informatica , 34, 7, 491541.
[52] P. Subedi, P. Davis, S. Duan, S. Klasky, H. Kolla, and M. Parashar. 2018. Stacker: an autonomic data movement engine for extreme-scale data staging-based in-situ workflows. In SC18: International Conference for High Performance Computing, Networking, Storage and Analysis . IEEE, 920-930.
[53] S. Thapaliya, P. Bangalore, J. Lofstead, K. Mohror, and A. Moody. 2016. Managing i/o interference in a shared burst buffer system. In 2016 45th International Conference on Parallel Processing (ICPP) . IEEE, 416-425.
[54] S. Varrette, P. Bouvry, H. Cartiaux, and F. Georgatos. 2014. Management of an academic hpc cluster: the ul experience. In 2014 International Conference on High Performance Computing & Simulation (HPCS) . IEEE, 959-967.
[55] V Vishwanath, W Feng, M Gardner, and J Leigh. 2006. A high-performance sensor for cluster monitoring and adaptation. EVL technical document .
[56] T. Wang, S. Byna, B. Dong, and H. Tang. 2018. Univistor: integrated hierarchical and distributed storage for hpc. In 2018 IEEE International Conference on Cluster Computing (CLUSTER) . IEEE, 134-144.
[57] W.Wang.2003.Modellingconditionmonitoringintervals:ahybridofsimulation and analytical approaches. The Journal of the Operational Research Society , 54, 3, 273-282. issn: 01605682, 14769360. http://www.jstor.org/stable/4101621.
[58] V. M. Weaver. 2015. Self-monitoring overhead of the linux perf_ event performance counter interface. In 2015 IEEE International Symposium on Performance Analysis of Systems and Software (ISPASS) . IEEE, 102-111.
[59] J. Xia, D. Guo, L. Luo, and G. Cheng. 2020. Topology-aware data placement strategy for fault-tolerant storage systems. IEEE Systems Journal .
[60] B. Yang, X. Ji, X. Ma, X. Wang, T. Zhang, X. Zhu, N. El-Sayed, H. Lan, Y. Yang, J. Zhai, et al. 2019. End-to-end i/o monitoring on a leading supercomputer. In 16th { USENIX } Symposium on Networked Systems Design and Implementation ( { NSDI } 19) , 379-394.
[61] S. R. Young, D. C. Rose, T. Johnston, W. T. Heller, T. P. Karnowski, T. E. Potok, R. M. Patton, G. Perdue, and J. Miller. 2017. Evolving deep networks using hpc. In Proceedings of the Machine Learning on HPC Environments , 1-7.
[62] 2020. Zabbix. Zabbix, LLC, (2020). https://www.zabbix.com/.